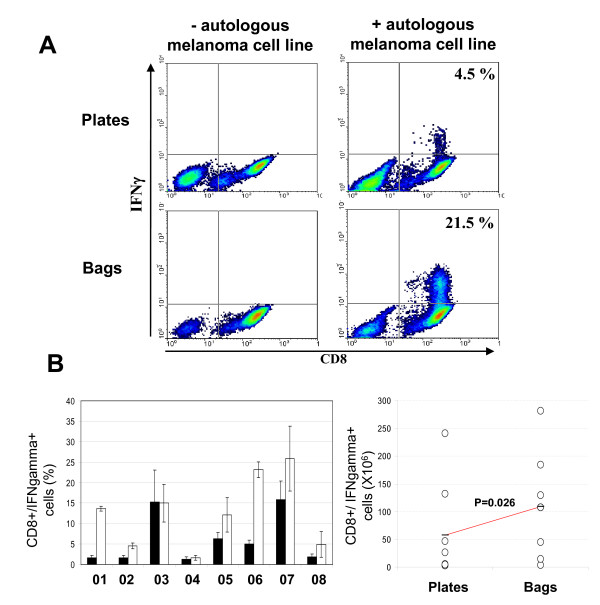
Figure 4.
IFNγ expression by TIL produced in plates vs bags. A, representative cytometry dot plots of cells produced in plates (upper panel) and bags (lower panel) double stained for CD8 and IFNγ (see "Materials and Methods") after 6 hours in contact (right panel) or not (left panel) with the autologous melanoma cell line. Representative data obtained from patient 06. Percentages of CD8+/IFNγ+ cells are shown. B, graphical representation of the percentage of CD8+ cells expressing IFNγ in plates (black histograms) and in bags (white histograms) for all donors. C, Total number of CD8+/IFNγ expressing cells produced in plates versus bags. Circles correspond to the mean of CD8+/IFNγ expressing cells obtained for each donors. Left and right circle lines correspond to TIL expanded in plates and bags, respectively. For each line the horizontal bar corresponds to the mean of the 8 donors. The difference between these means is indicated by the p-value.

