
Figure 5.
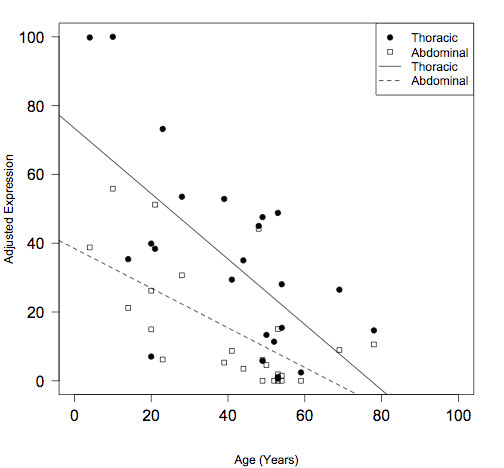
HOXA4 protein levels decrease with age. Using ACTB-adjusted HOXA4 protein levels, regression lines were calculated for age versus thoracic or abdominal aortic protein levels. Slopes were significantly different from zero. Thoracic: slope = -0.95 (99% C.I. -1.66, -0.24); R2 = 0.43; F-statistic P = 0.0005. Abdominal: slope = -0.58 (99% C.I. -1.02, -0.13); R2 = 0.41; F-statistic P = 0.00075.