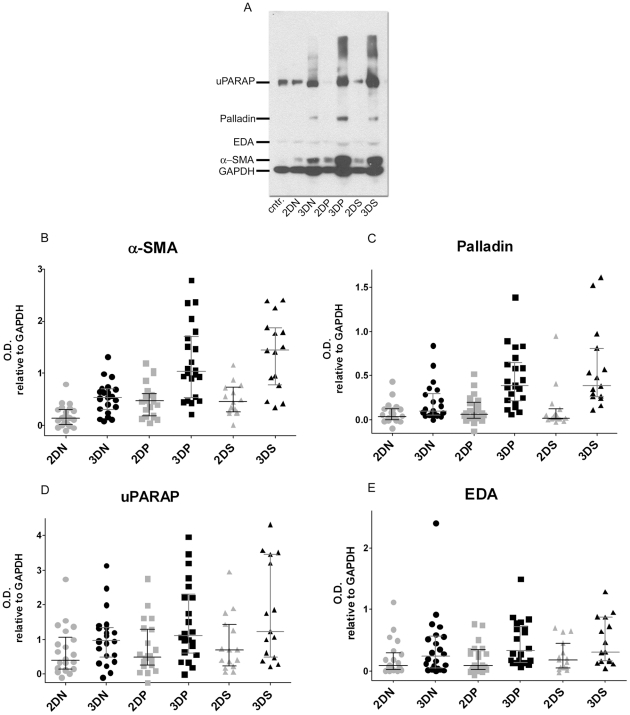
Figure 2. Expression levels of in vitro stromal markers are 3D matrix dependent.
Lysates from fibroblasts cultured in 2D and 3D conditions were subjected to Western Blot analyses. A is a representative gel showing a fibroblastic cell line control (Wi38) and samples corresponding to fibroblasts harvested from normal kidney tissue (N), primary tumor (P) and secondary metastatic lymph node positive tumor (S) corresponding to case number #6 in Table 2. B-E panels show optical densities (O.D.) calculated for the assorted stromal markers relative to GAPDH. Each dot represents a single cell line. Median values as well as 25 and 75 percentiles are shown. Note the variation of the medians between 2D and 3D conditions. See Table S2 for details.

