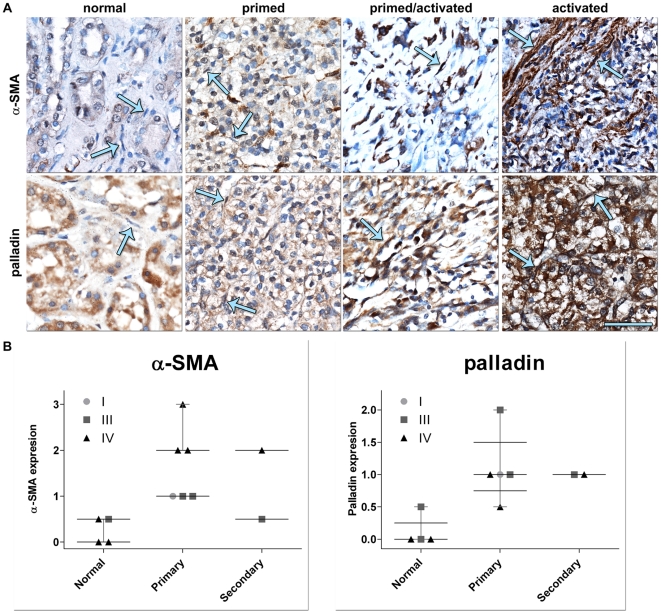
Figure 5. In vivo kidney stroma is sorted into progressive stages correlating the ones observed in vitro.
Representative α-SMA and palladin immunohistochemistry (A) labeled images matching samples shown in Figure 4 corresponding to Table 2 cases: #5 for both normal or non-tumorigenic (normal stroma) and tumor (activated stroma), #1 (primed stroma) and #2 (primed/activated or intermediate stroma). Arrows in A are pointing to stromal cells. Barr represents 50 µm. Note that, although palladin is localized to the epithelial components of the tissue samples, the stromal marker expression and patterning of both α-SMA and palladin are incremented according to the stage of the stroma. Graphs in B represent the in vivo stromal levels of expression of α-SMA and palladin sorted by tumor stage and by tissue type (medians and distributions are shown). See Table S4 for details.

