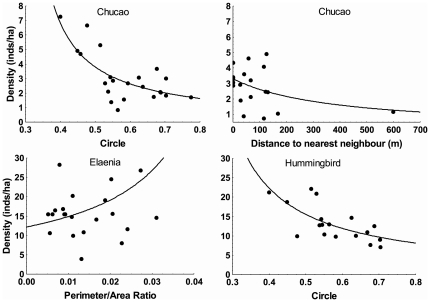
Figure 2. Partial residual plots showing the effects of patch characteristics on species densities (birds/ha).
Effect of patch shape (CIRCLE and P/A Ratio) and connectivity (distance to the nearest neighbor) on chucao density (upper two panels), elaenia (lower left panel) and hummingbird (lower right panel). Filled circles represent values obtained after adding raw residuals to predicted values for each variable (assuming mean values for the remaining covariates), and then back-transforming the resultant value. Eliminating the apparent outlier for distance to the nearest neighbor did not change the model and hence it was retained (see Methods).

