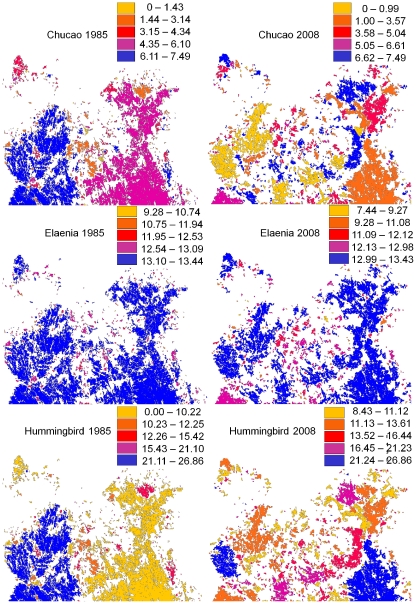
Figure 3. Estimated densities for three of the study species in 1985 and 2008.
Calculations combine GLMs relating patch characteristics (size, shape and connectivity) to bird density, fitted to field data from 2008, and the analysis of patch characteristics based on satellite images from 1985 and 2008.

