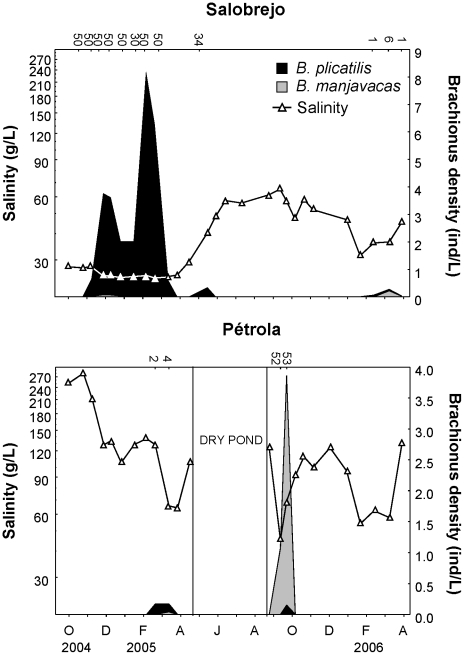
Figure 2. Salinity variation and population density.
Salinity variation and population densities of B. plicatilis and B. manjavacas from October 2004 to April 2006 in Salobrejo and Pétrola lakes. Density estimates are based on the relative frequencies of the two species analyzed by RFLP. Numbers on top are the number of individuals analyzed. Note that population density scale is different in each graph.

