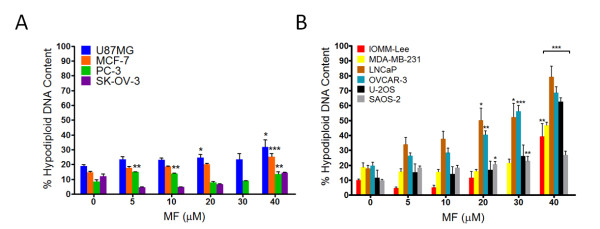
Figure 3.
Hypodiploid DNA content in MF-treated cancer cells. Cells were exposed to vehicle or MF for 72 h, harvested, and stained with propidium iodide. DNA content was analyzed by microcytometry. Bars represent the mean ± s.e.m. of at least 3 independent experiments completed in triplicate, and show the percentage of cell particles with hypodiploid DNA content indicative of cell death. (A) A modest increase in the proportion of cells with hypodiploid DNA content was observed in cell lines that responded to MF by accumulating in G1 phase (see Figure 2). (B) A large, dose-dependent increase in the proportion of cell particles with hypodiploid DNA content was observed in cell lines that did not show an accumulation in G1 phase in response to increasing concentrations of MF (see Figure 2). *P < 0.05, **P < 0.01, ***P < 0.001 denote difference as compared to controls.

