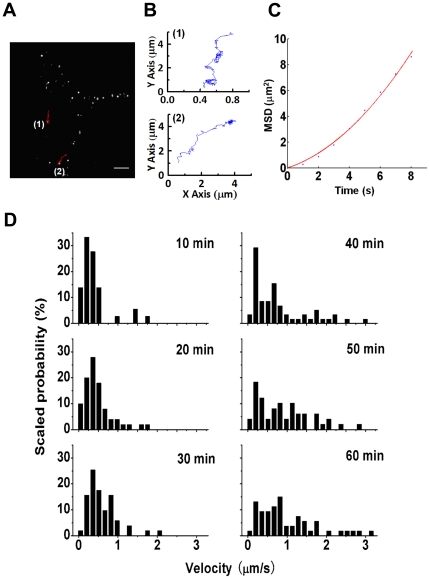
Figure 1. Tracking α1A-AR in response to agonist stimulation.
(A) α1A-ARs were detected with anti-FLAG antibody and Alexa-555 IgG in live HEK-293A–α1A-AR cells at 37°C. Images were captured after 30-min stimulation with 10 µM phenylephrine (PE). Two sample trajectories of α1A-AR particles are shown with red lines (1 and 2). Bar: 10 µm. (B) The trajectories in (A) were plotted (1 and 2, respectively). (C) The plot of the mean square displacement (<r2>) against time (t) to the trajectory in Fig. B(2). The red line is a fit by <r2> = 4Dt+(vt)2. Directed movement was confirmed by the superlinear MSD-Δt plots. (D) Velocities of directional movements of α1A-AR resolved from tracked trajectories at various times after 10 µM PE stimulation plotted in probability histograms. (n = 36, 61, 51, 58, 49 and 53 trajectories in separated cells, respectively).

