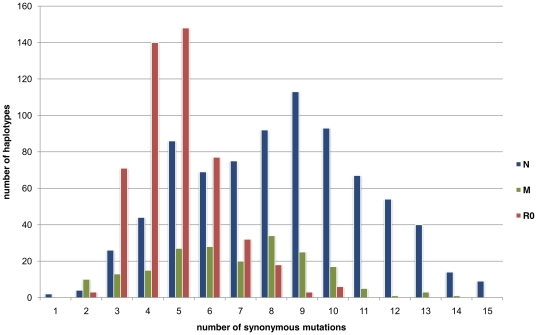
Figure 7. Phylogenetic distance distribution of R0, N, and M haplotypes.
The data are based on the Mitomap dataset and the phylogenetic distance was calculated by determining the number of synonymous mutations separating haplotypes belonging to haplogroups N and M from MRCA-L3 (based on Mitomap data).

