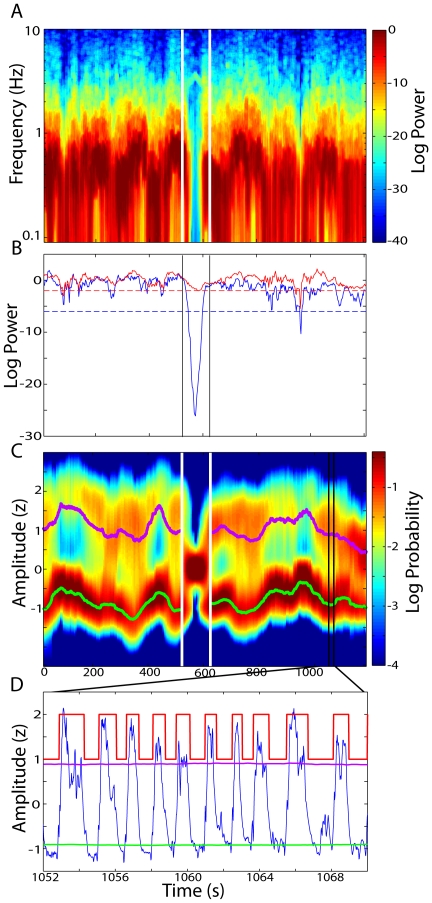
Figure 3. Procedure for selecting data epochs with clear UDS.
A) The multi-taper spectrogram of a cortical LFP. White vertical lines indicate a period of desynchronized activity with decreased power in the low-frequency (UDS) range. B) The maximum power in the UDS range (0.05–2 Hz; blue trace) and the high-frequency power (4–40 Hz; red trace) are extracted from the spectrogram. Threshold values (dashed lines) for each of these statistics are used to locate data segments that have insufficient UDS power while having substantial high-frequency power. These desynchronized epochs (highlighted by the vertical lines) are excluded from all analysis. C) The sliding-window density estimate of the low-frequency (0.05–2 Hz) LFP amplitude from the same recording is plotted along with the time-varying UP (violet) and DOWN (green) state-conditional means estimated from the HMM. The period of desynchronized activity (vertical white lines) shows a loss of bimodality. D) An example LFP trace (blue) taken from the region of the recording indicated by the black lines. The violet and green traces again represent the time-varying UP and DOWN state-conditional means. The red trace shows the inferred UDS state sequence.

