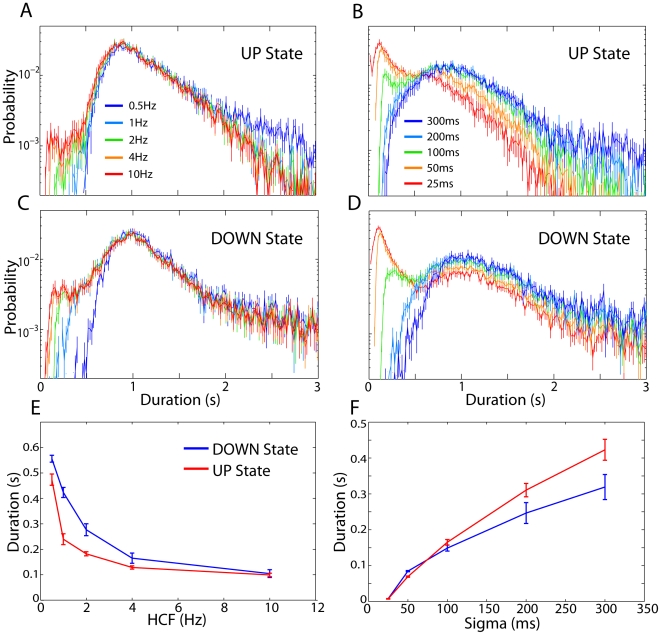
Figure 5. Dependence of UDS classification on signal preprocessing.
A) The average UP state duration distribution for HMM classification based on the filtered LFP amplitude is plotted for several different values of the high-cutoff frequency (HCF). As the HCF increases from 0.5 Hz to 10 Hz, the UP state duration distribution starts to develop a secondary peak at short durations (<200 ms). B) Same as A for inference based on high-frequency LFP power using several different values of the Gaussian smoothing sigma. In this case the short duration peak is more pronounced than for classification of the low-frequency LFP amplitude, and it appears for smoothing windows as large as sigma = 100 ms. C–D) Same as A–B for the DOWN state duration distributions, showing similar effects of filtering and smoothing on the detected state durations. E) The minimum DOWN (blue) and UP (red) state durations, averaged across recordings (n = 21), is plotted as a function of the HCF. For HCFs as low as about 2 Hz, state durations as short as 200 ms are still detected. F) Same as E for the high-frequency power based classification. As the smoothing sigma is increased above about sigma = 150 ms the minimum state duration exceeds 200 ms.

