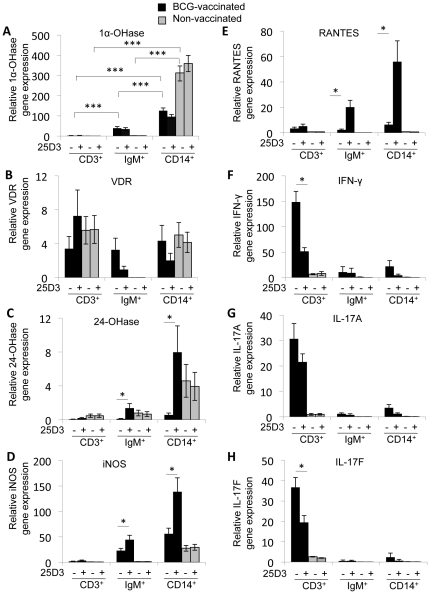
Figure 4. Cell-type specific regulation of vitamin D signaling.
PBMCs from seven M. bovis-BCG-vaccinated calves (black bars) and four non-vaccinated calves (grey bars) were treated with 10 µg/ml of M. bovis PPD and 0 or 100 ng/ml 25(OH)D3 as indicated for 24 h. After treatment, PBMCs were sorted by FACS according to CD3/4/8/γδTCR (CD3; T cell), IgM (B cell), and CD14 (monocyte) expression on the cell surface. The amount of 1α-OHase (A), VDR (B), 24-OHase (C), iNOS (D), RANTES (E), IFN-γ (F), IL-17A (G), and IL-17F (H) mRNA in the sorted cells was determined by quantitative real-time RT-PCR. The amount of mRNA for each gene was normalized to the amount of RPS9 mRNA in each sample. Expression of each gene in each cell type is relative to non-stimulated, non-sorted PBMCs. Error bars represent SE. * P<0.05, *** P<0.001, Means are different.

