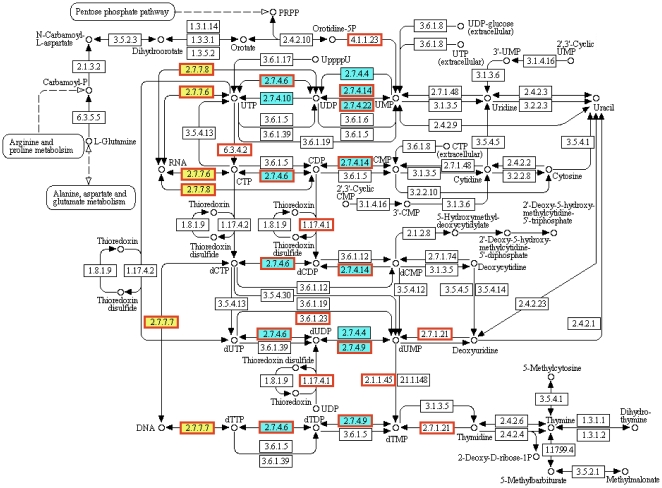
Figure 6. Overrepresentation of EC 2.7.7 and EC 2.7.4 in essential genes involved in pyrimidine metabolism pathway.
Part of the pyrimidine metabolism map is shown. The DAVID database was used to identify pathways in which essential genes are enriched, using E. coli as an example. Red rectangles denote reactions involving essential genes; filled yellow and blue boxes represent EC 2.7.7 (nucleotidyltransferase) and EC 2.7.4 (phosphotransferase), respectively.

