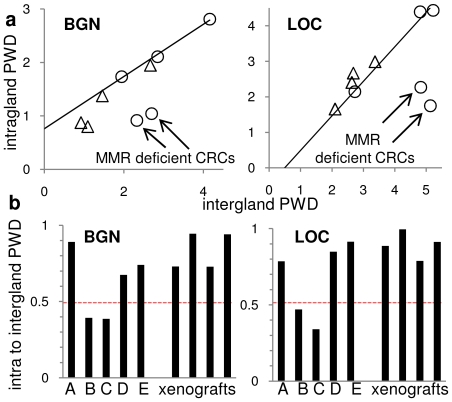
Figure 5. Intragland versus intergland PWDs.
A. Intra- and intergland PWDs generally correlate. The trend line is based on three human CRCs, with the two MMR deficient cancers with much lower intragland PWDs. (circles are human CRCs, triangles are the clonal and polyclonal xenografts). B. Ratios of intra- to intergland PWDs were greater than 0.5 except for the MMR deficient CRCs, indicating much greater extinction within glands of the MMR deficient CRCs.

