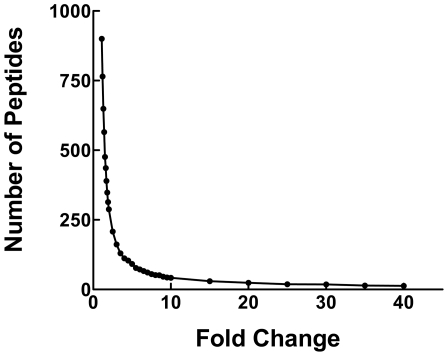
Figure 4. Distribution of rapamycin-induced fold-change in phosphopeptide abundance.
For each peptide identified in all three control samples, fold-change in response to rapamycin was determined to be the minimum fold-change among the three paired analyses generated for each phosphopeptide. The graph shows the number of peptides in categories ranging from less than 1.1-fold different to 40-fold different or greater.

