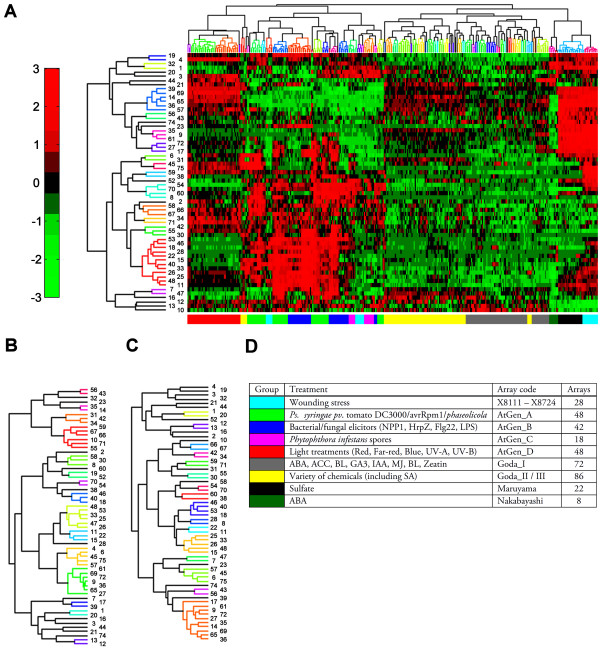
Figure 1.
Bi-clustering of WRKY genes under different experimental conditions. Bi-clustering of WRKY genes under stress conditions (A), development-related processes (B), and all micro-arrays in the dataset (C). The colors in the bar underneath the bi-clustering in panel A correspond to the colored datasets of the selected microarray experiments listed in (D). The numbers on the left side of the bi-clustering indicate the corresponding WRKY numbers. Similarly colored branches within the dendogram represent groups with a linkage between nodes lower then 0.50. The color range in the bi-clustering matrix ranges from +3 (red, above average expression) to -3 (green, below average expression).

