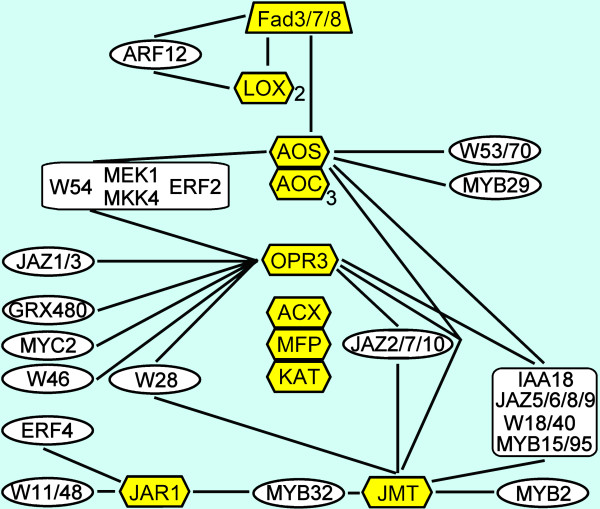
Figure 5.
Co-expression network of the JA biosynthesis pathway. The genes in the yellow boxes in the network correspond to the yellow-colored components of the JA biosynthesis pathway indicated in Figure 2. The genes in white boxes indicate co-expressed genes with at least one edge to the pathway genes.

