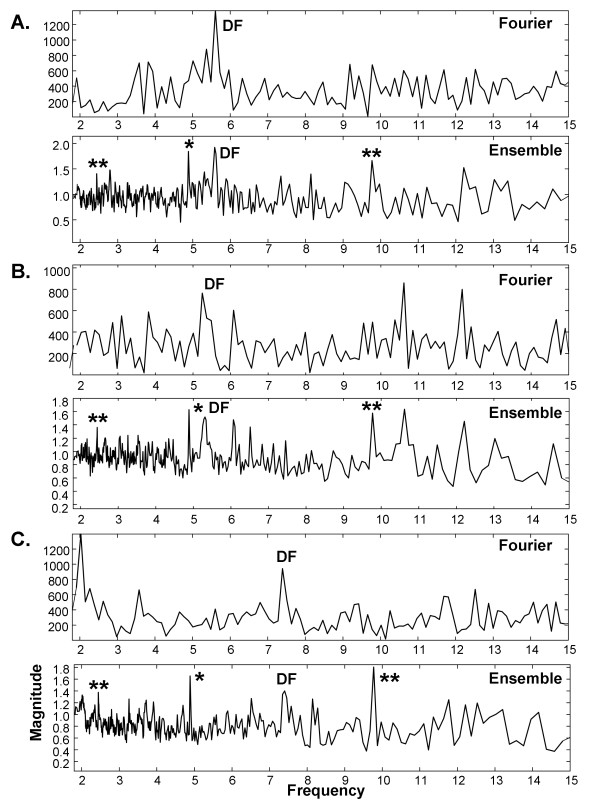
Figure 11.
Additional examples of Fourier versus ensemble average power spectra with the transient added to CFAE signals. Transient peak is marked by * and harmonics by **; DF is labeled. A. paroxysmal AF, anterior left atrial free wall, B. persistent AF, left inferior pulmonary vein ostia, C. paroxysmal AF, left inferior pulmonary vein ostia.

