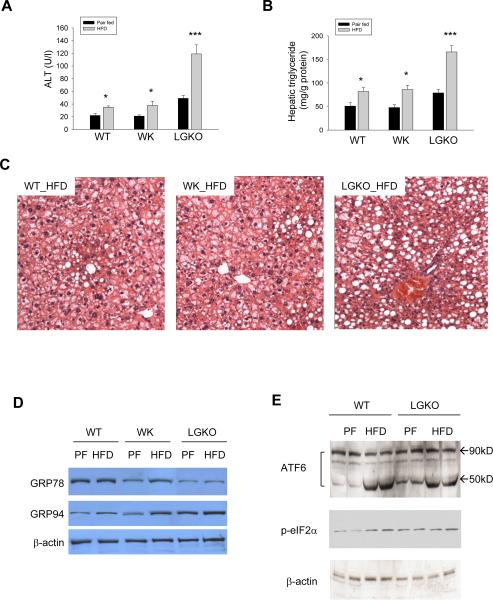
Figure 4. Effects of high fat diet (HFD) feeding on wild type (WT) versus mice with heterozygous (WK) or homozygous (LGKO) liver Grp78 deletion.
(A) Serum ALT; (B) Liver triglycerides; (C) Liver tissue with H&E staining showing fatty liver (×200); (D) Western blots showing liver protein levels of GRP78 and 94. (E) Western blots of liver proteins showing activation of ATF6α and phosphorylation of eIF2α; PF, pair-fed control; Black bar, pair-fed control (PF); Grey bar, HFD; *p<0.05, **p<0.01 and ***p<0.005 compared to pair-fed control, n=3.

