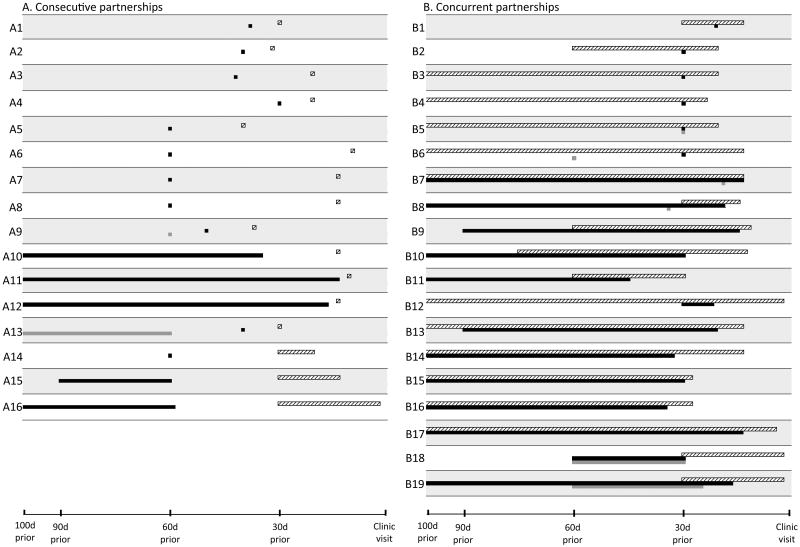
Figure 2. Patterns of consecutive and concurrent partnerships among those reporting multiple partners.
Partnership patterns are shown for each of the 35 participants whose patterns in the two months prior to the STI clinic visit could be categorized as either exclusively consecutive (Figure 2A) or having one or more sets of concurrent partners (Figure 2B). For ease of presentation, the time axis is left-truncated at 100 days prior to the STI clinic visit. Each numbered row represents the partnership pattern for one participant. Within each row, the horizontal white, black, and dark gray bars represent the partners contacted most recently, second-most-recently, and third-most-recently, respectively. The four participants who reported 2 or more partners but could not be classified as having consecutive vs. concurrent partnerships (due to missing data) are excluded.

