
Figure 6.
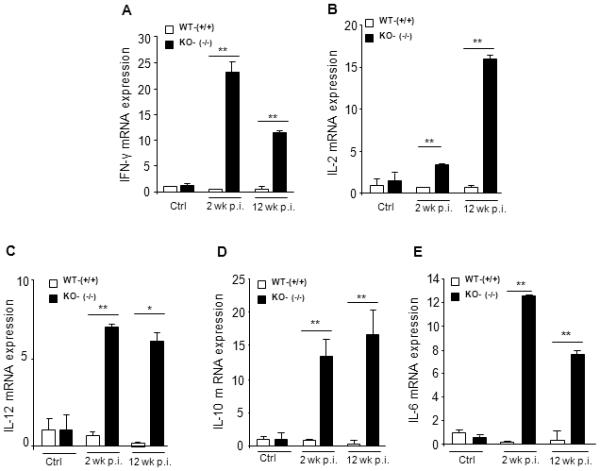
Liver cytokine expression reveals loss of cytokine interdependence in Mta1 (−/−) mice. Analysis of liver cytokine mRNA levels in Mta1-WT (+/+) and Mta1-KO (−/−) mice. 50 mg of liver tissue was used for RNA isolation and cDNA synthesis. Expression levels of Th1 and Th2 cytokine was assessed by Quantitative real-time PCR.* P <0.01 **P<0.001.