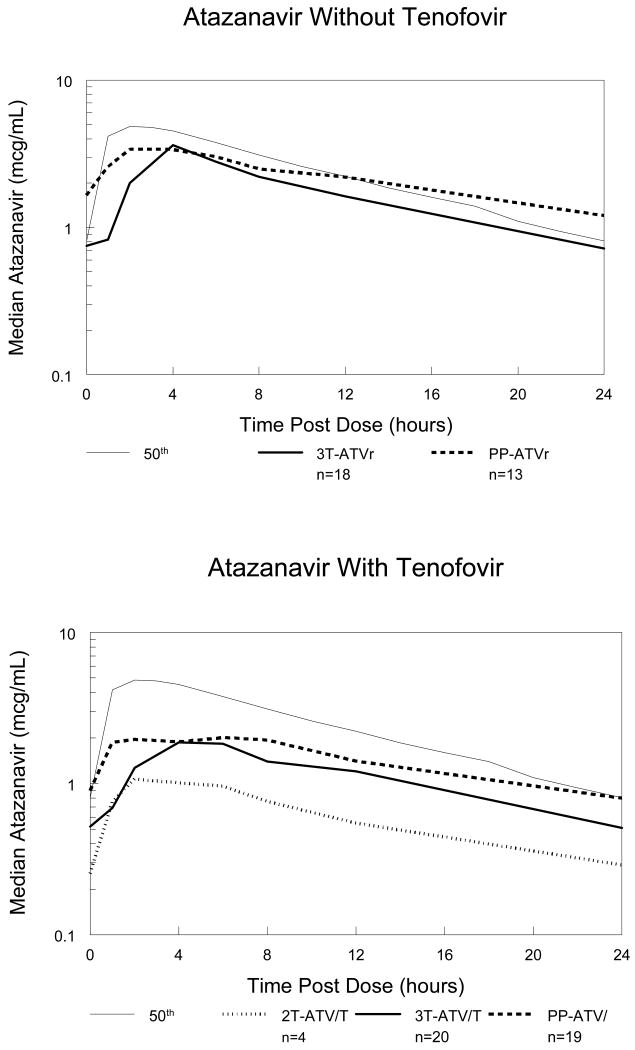
Figure 1. Median atazanavir concentrations during pregnancy and postpartum.
Median atazanavir concentration-time curves for atazanavir without tenofovir subjects (top graph) and atazanavir with tenofovir subjects (bottom graph). The thin solid line represents the expected (50th percentile) concentration-time profile in non-pregnant adults.

