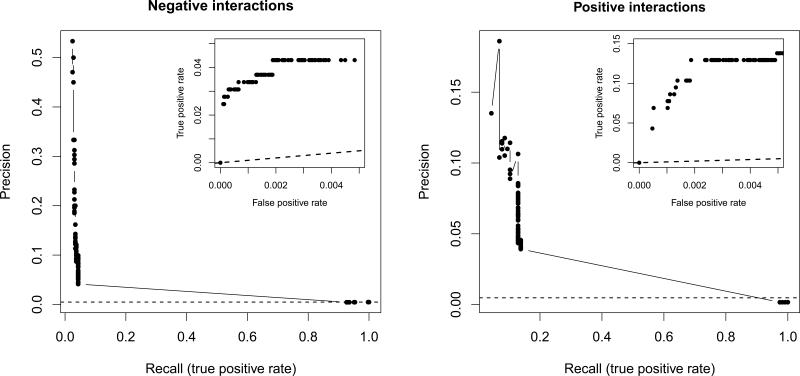
Figure 3.
Comparison of computationally predicted and empirically determined genetic interactions. Prediction accuracy evaluated by visualizing the trade-off between precision (fraction of predicted interactions that are supported by empirical data) and recall (fraction of empirical interactions that are successfully identified by the model), and true-positive and false-positive rates (partial ROC curves, inset) at different in silico genetic interaction score cut-offs. Dashed lines represent the levels of discrimination expected by chance. Note the different scale of the y-axes for negative and positive interactions.

