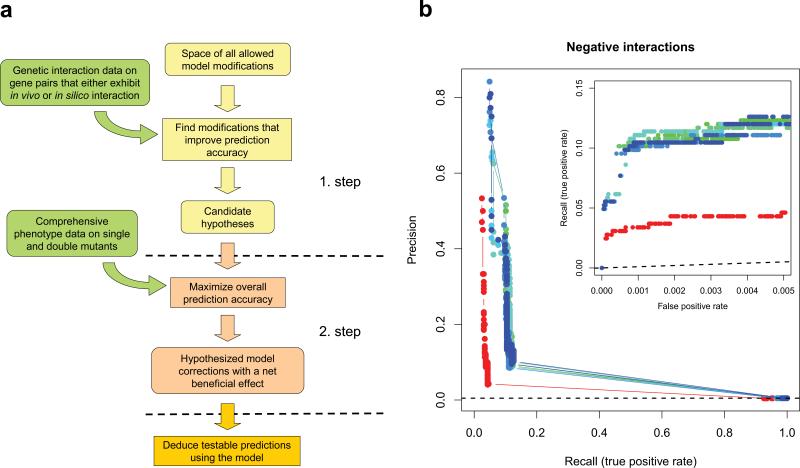
Figure 4.
Automated model refinement procedure. (a) Workflow of the two-stage model refinement method. In the first stage, a coarse-grained search is executed where candidate models are evaluated only for those gene pairs that display interaction either in vivo or in silico, according to the original model. In the second stage, the best models are refined in a restricted search space that is based on the results of the first stage, but now using all available data to evaluate the models. This two-stage approach made it feasible to explore a large space of candidate hypotheses while also making use of all available phenotypic data. (b) Results of 8 independent runs of the model refinement algorithm. Fits of the modified (blue – green) and unmodified original (red) models to our empirical genetic interaction data are visualized by both precision-recall and partial ROC curves (inset). Dashed lines represent the levels of discrimination expected by chance. Note that the same empirical dataset was used for both model refinement and model evaluation, i.e. no unseen test data was used to generate these plots. For a cross-validation estimate of model improvement see main text and Supplementary Note.

