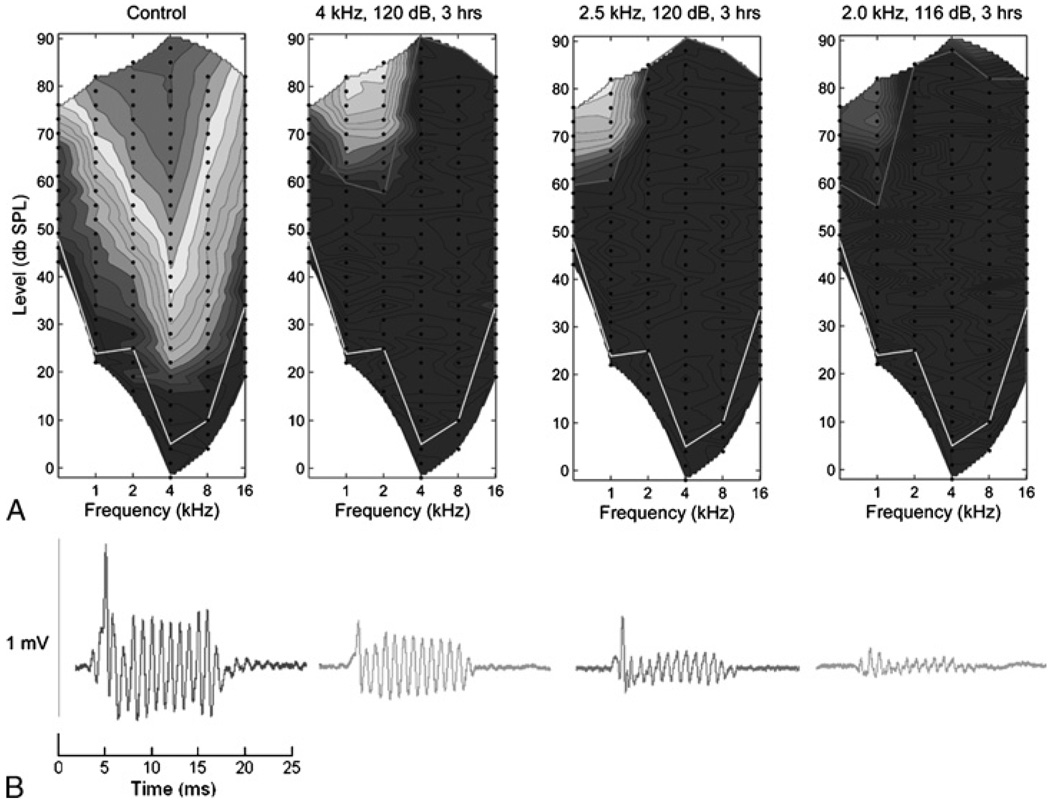
FIG. 5.
Near-field (round window) recordings. A, Response area graphs representing CAP amplitudes for a control case and 3 noise exposure cases The color scale is from 25 (dark blue) to 60 dB (red), re 1 µV, with 15 equally spaced contours. Black dots are the stimuli presented, and lines are interpolated isoresponse contours. The white line indicates the threshold for the control ear, and the red lines are the threshold for each case). B, Raw waveforms including the CM and CAP responses to a frequency stimulus at 1,000 Hz and 81 dB SPL, averaged over 100 stimuli. Importantly, even in the setting of profound hearing loss to high frequencies, near-field responses to preserved frequencies remain robust.

