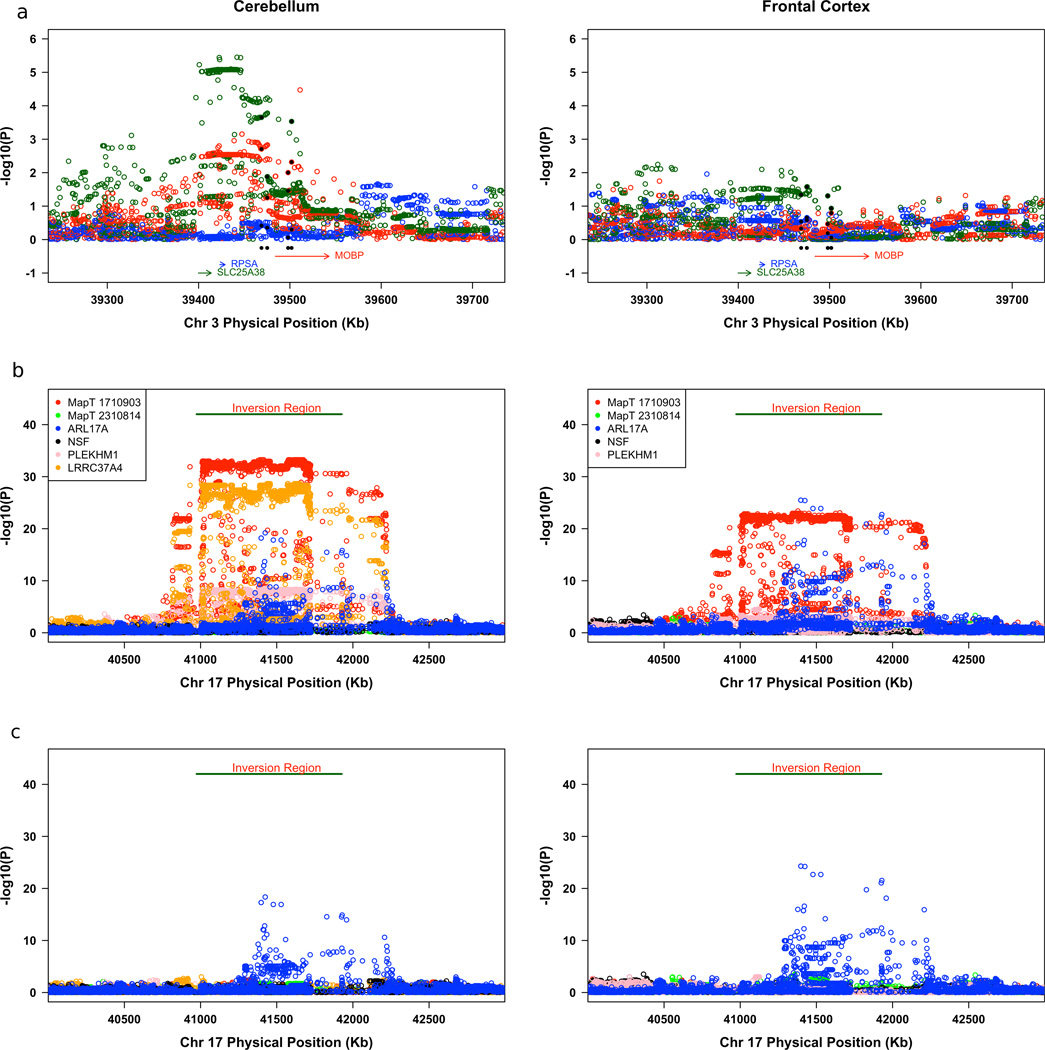
Figure 3.
(a) Association results for the relationship between SNP genotypes and mRNA transcripts from the cerebellum and frontal cortex for the SLC25S38/MOBP region. (b) Association results for the relationship between SNP genotypes and mRNA transcripts from the cerebellum and frontal cortex for the H1/H2 inversion polymorphism region. (c) Association results for the relationship between SNP genotypes and mRNA transcripts from the cerebellum and frontal cortex for the H1/H2 inversion polymorphism region controlling for H1/H2. The color of the circle corresponds to the color assigned each gene and each SNP is tested against multiple cis transcripts. The data presented here are independent samples from those used previously by Simon-Sanchez et al.12.

