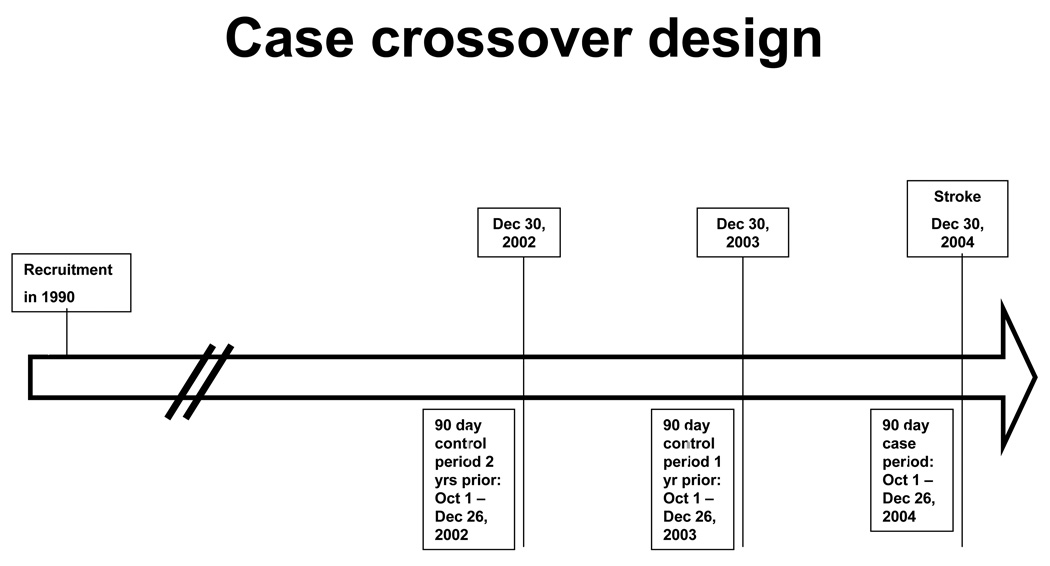
Figure 1. Illustration of the case crossover design.
The figure shows an example timeline illustrating case and control time periods for a hypothetical participant who enrolled in the study in January 1990 and had a stroke on December 30, 2004. The case period represents the 90 days prior to the stroke, excluding the 4 days immediately preceding the stroke, as infections during those dates were considered to possibly be secondary to stroke rather than preceding it. Control periods represent the same calendar periods 1 and 2 years prior to the stroke. More remote time periods were not included as their inclusion could add to bias due to participant aging in the case-crossover analyses, because participants serve as their own controls. Analyses then compared the prevalence of hospitalization for infection between case and both control time periods considered together. Analyses were repeated for 30 day and 14 day time windows.

