
Figure 1.
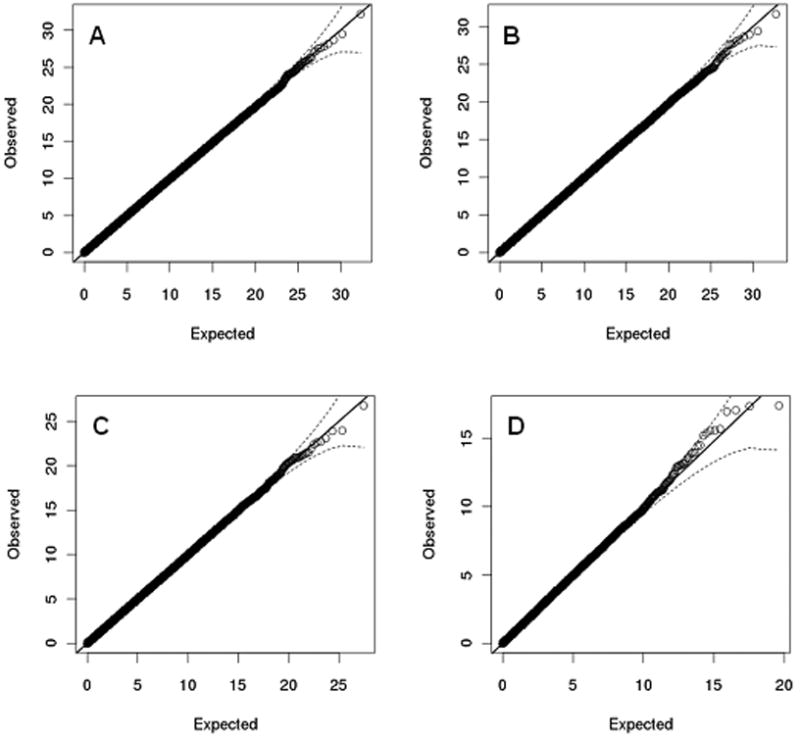
Q-Q plots for SNP-SNP interaction analyses of SNPs with MAF>0.1 (the dotted line represents 95% confident intervals).
A. All SNPs with association p-values ≥0.95.
B. Top significant SNPs at 5% level and non-independent SNPs at r2≥0.5 removed.
C. Top significant SNPs at 1% level and non-independent SNPs at r2≥0.5 removed.
D. Top significant SNPs at 0.1% level and non-independent SNPs at r2≥0.5 removed.