Figure 3.
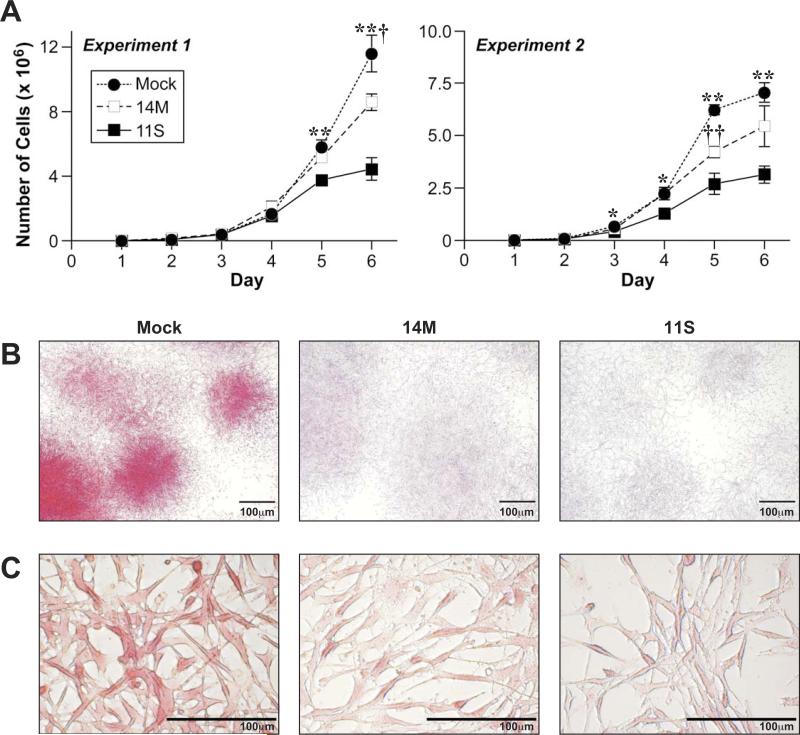
Growth kinetics and colony morphology of Tbx1-expressing tumor cells. (A) Cell lines were seeded (1×10⁴ cells) into either T25 culture flasks (experiment 1) or 6 well culture dishes (experiment 2) and counted daily for 6 days. *, Mock is significantly greater than 11S at p < 0.01. **, Mock is significantly greater than 11S at p < 0.001. †, Mock is significantly greater than 14M at p < 0.01; ††, Mock is significantly greater than 14M at p < 0.001. (B) Cells were stained with Rhodamine B to visualize colony morphology. Scale bar = 100 μm. (C) Cell morphology of Rhodamine B-stained Mock, 14M, and 11S cells. Scale bar = 100 μm.

