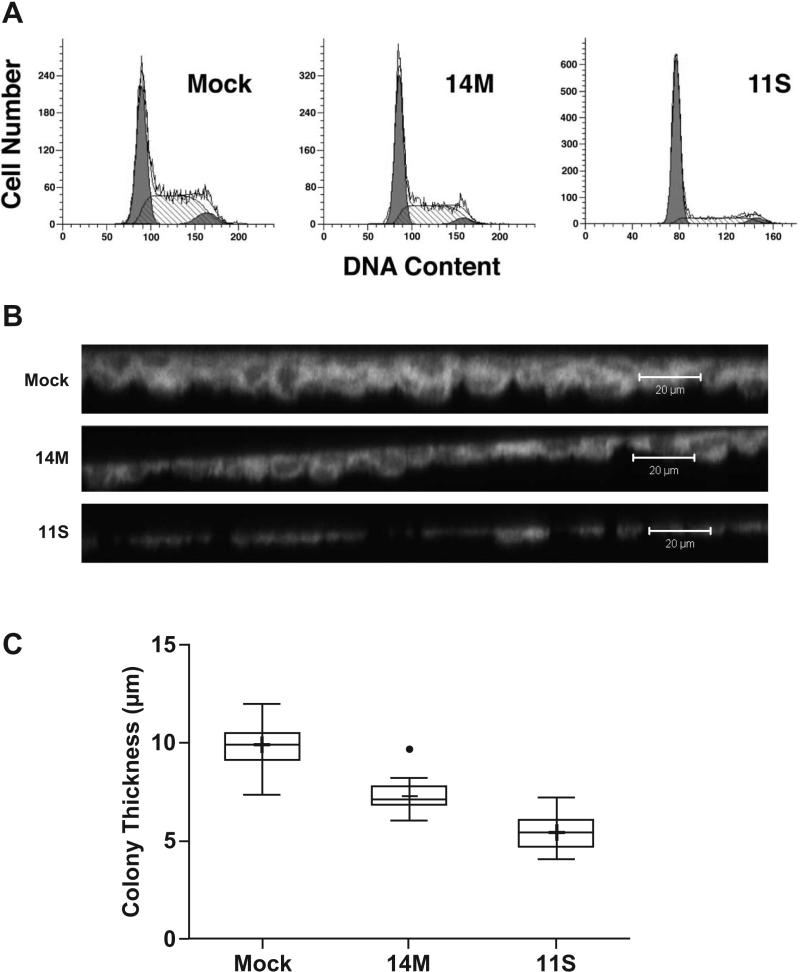
Figure 4.
Cell proliferation and colony thickness of Tbx1-expressing cell lines. (A) Cell lines were analyzed for DNA content by flow cytometry following staining with propidium iodide and using Modfit software. (B) Confocal images were taken of Rhodamine B-stained cells (6 days in culture) to collect thickness measurements. Scale bar = 20 μm. (C) Measurements were collected from 6 colonies in each of 3 wells per cell line. Mock is significantly greater than 11S (*) and 14M (†) at p < 0.0001 by Tukey's multiple comparisons procedure.

