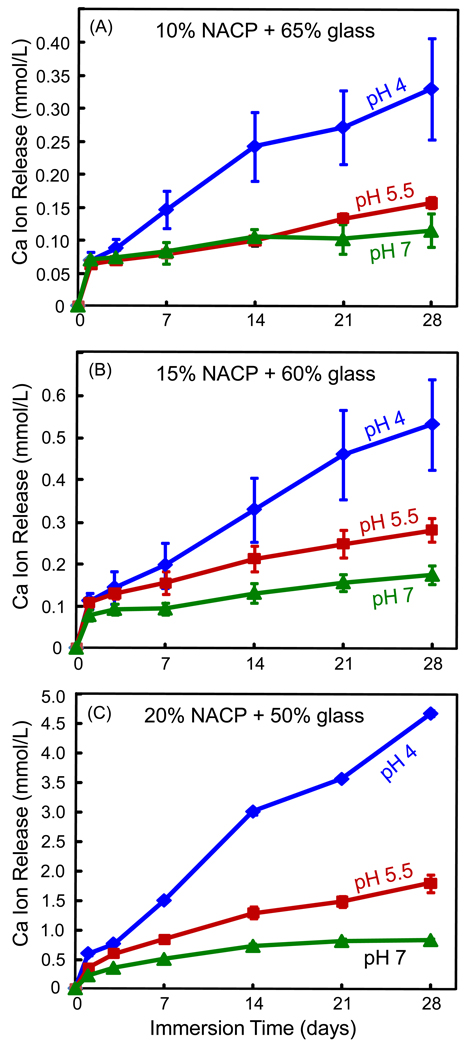
Figure 3.
Ca ion release from the nanocomposite filled with: (A) 10% NACP and 65% glass, (B) 15% NACP and 60% glass, and (C) 20% NACP and 50% glass. Ca ion release increased with increasing the immersion time and the NACP filler level. Ca release increased with decreasing the solution pH. Each value is the mean of three measurement, with the error bar showing one standard deviation (mean ± sd; n = 3).

