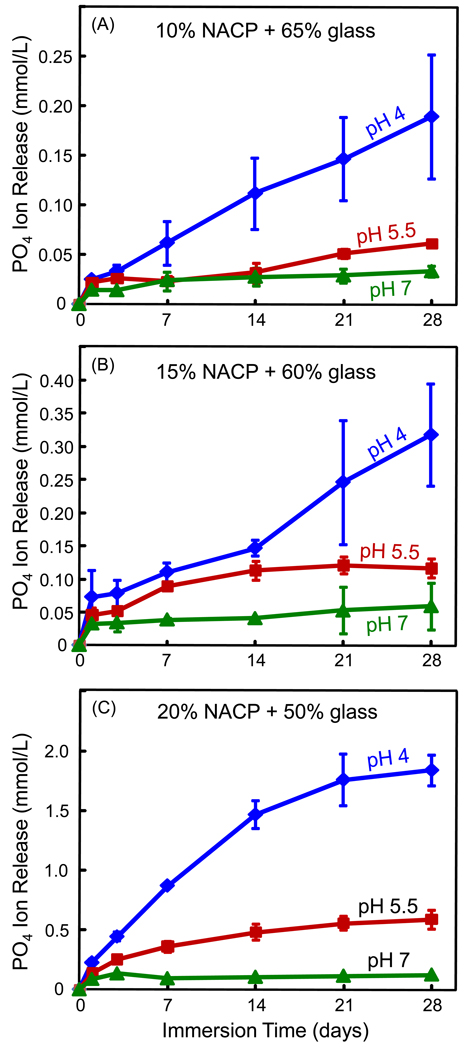
Figure 4.
PO4 ion release (mean ± sd; n = 3) from the nanocomposite filled with: (A) 10% NACP and 65% glass, (B) 15% NACP and 60% glass, and (C) 20% NACP and 50% glass. The release of PO4 significantly increased with longer immersion time and higher NACP filler level, or with decreasing the solution pH.

