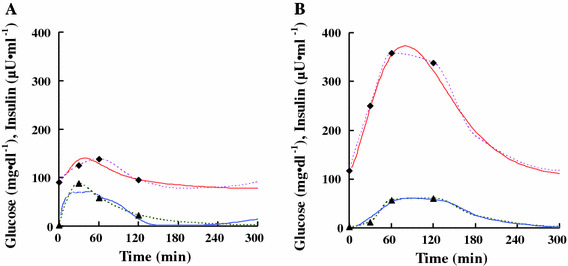
Fig. 6.

Examples of pre-processed and parameter-derived OGTTs. Squares and triangles represent glucose and insulin concentrations, respectively. Dotted lines represent extrapolated and interpolated data. Solid lines represent glucose and insulin concentrations calculated by the estimated parameters. a NGT, b T2D
