Figure 2.
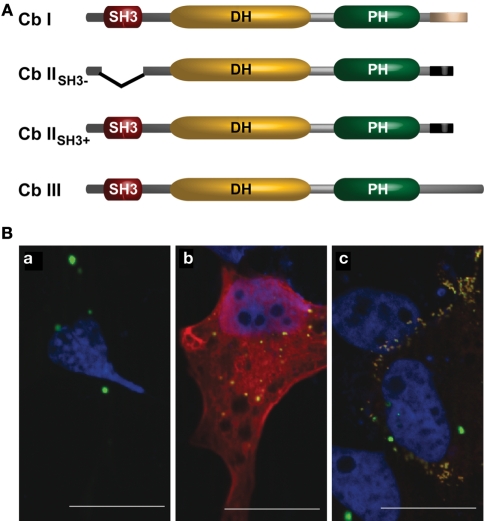
(A) Schematic representation of the domain structures of known Cb isoforms (according to Kins et al., 2000; Harvey et al., 2004). (B) Co-expression of Cb isoforms differentially affects gephyrin distribution in COS7 cells. COS7 cells expressing either (a) GFP–gephyrin alone (green), or together with (b) Myc-tagged CbIISH3+ (red), or (c) Myc-tagged CbIISH3− (red) are shown. Nuclei (blue) were visualized by DAPI-staining. Note that co-expression of Cb IISH3− and gephyrin induces the formation of numerous submembranous gephyrin clusters (c). Scale bars, 20 μm.

