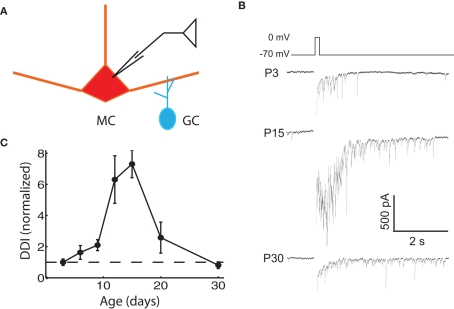
Figure 1.
Evoked DDI peaks at P15, and then declines. (A) Drawing of the recording configuration, in which glutamate release is evoked via voltage steps in the MC, and GABAergic IPSCs from GCs are recorded in the same MC. (B) Sample single trace of DDI evoked by 100 ms voltage step from −70 to 0 mV at three representative ages, with the period of the stimulus blanked. (C) DDI plotted as a function of age, normalized to the average value at P3 (dashed line drawn through ordinate value of 1). N = 4 cells for P3, P12, and P30; N = 3 for P6, P9, P15, and P20. The DDI at P12 and P15 were significantly higher than at all other ages, except P12 was not significantly higher than P20 (ANOVA p = 1.0e−4; pairwise comparison by Tukey’s HSD test, p < 0.05).

