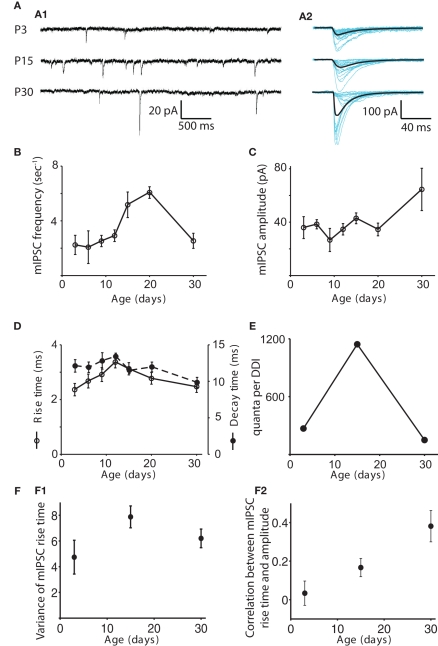
Figure 3.
Changes in the properties of mIPSCs with age. (A) Examples of mIPSCs recorded in mitral cells at P3, P15, and P30 in 1 μM TTX, 100 μM APV, and 5 μM CNQX. (A1) Sample recordings at each age. (A2) Individual mIPSCs recorded in a different cell are shown aligned by their onset (blue), and the average mIPSC is shown in black. (B–D) mIPSC frequency, amplitude, rise time and decay time are shown as functions of age. N = 11 cells for P3, P6, P9, and P30; N = 12 for P12, P15, and P20. The frequency of mIPSCs remains steady for P3–P12, peaks at P20, and then drops back down at P30. The frequency at P20 is significantly higher than those at P3, 6, 9, and 30 (ANOVA p = 0.0012, pairwise comparison by Tukey’s HSD test, p < 0.05). The amplitude of mIPSCs increases significantly with age, being significantly higher at P30 than at P9 (Tukey’s p < 0.05). Rise time peaks at P12; the P12 value is significantly higher than those at P3 and P30, while the P15 value is significantly higher than the P3 value (ANOVA p = 0.0012, Tukey’s p < 0.05). Decay time does not change significantly (ANOVA p = 0.42). (E) The number of quanta in a single DDI trial was obtained by dividing the integrated charge in the DDI by the integrated charge in the average mIPSC at each age. Note that the increased amplitude of the P30 mIPSCs outweighs the moderate speeding of its decay time to give it a larger area than the P3 and P15 mIPSCs. For clarity, data for only three representative ages are shown. Error bars are not included as the values are derived from other measurements. (F) Electrotonic filtering is not a source of variability in mIPSC kinetics. (F1) Mean variance of rise time vs. age. The variance of the rise times of all mIPSCs recorded in a particular cell is calculated, and the average variance for each age is plotted (N = 6 for each age). The variance does not change with age (ANOVA p = 0.12). (F2) Mean correlation coefficient of rise time and amplitude as a function of age. The correlation coefficient of rise time and amplitude for all mIPSCs recorded in a particular cell is calculated, and the average value for each age is plotted (N = 6 for each age). The positive correlation increases significantly with age (ANOVA p = 0.007).

