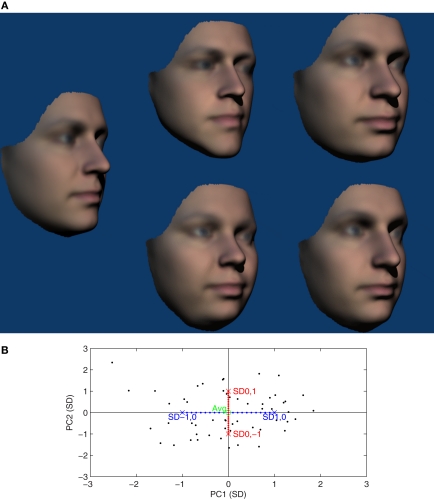
Figure 3.
(A) Examples stimuli used in Experiment 2. The average reference face is shown on the left and all other faces are 1 SD away. The top row shows PC2 zero faces and the bottom row PC1 zero faces. The average faces is shown here at 45° and other faces at 30° but in the experiment all were shown as temporally offset GIF animations rotating between 45° and −45°. (B) Two-dimensional illustration of the face-space used for Experiment 2. Black points show locations of the 54 faces used to define the face-space. The locations of the average reference face and the PC1 zero (0, ±1 SD) and PC2 zero (±1, 0 SD) comparison faces shown in (A) are also indicated. Red/blue points indicate possible locations of comparison faces for PC1 zero and PC2 zero conditions respectively.

