Figure 3.
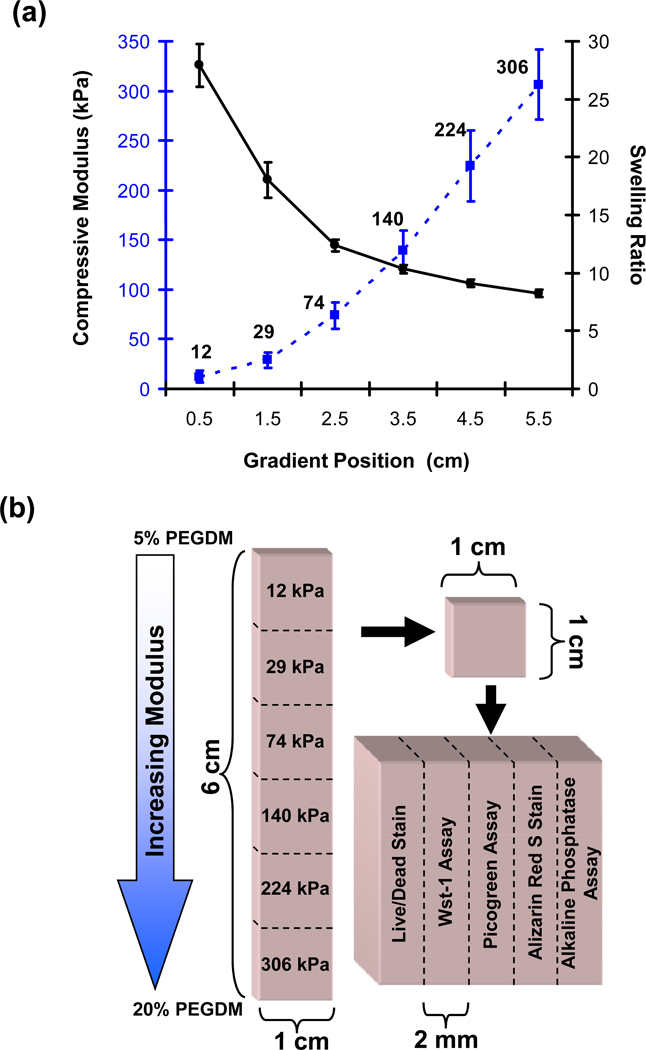
(a) The compressive modulus (dotted blue line) and swelling ratio (solid black line) are plotted for the gel at different positions along the gradient. Error bars are standard deviation and n is 18 for each data point. Guidelines are drawn to aid the eye. Statistical analyses are presented in Fig S1. (b) Experimental scheme to characterize the cell response in the gradient hydrogels. Gradients were cut into six segments of 1 cm × 1 cm × 3 mm along the direction of the stiffness gradient. To determine the cellular response the gels were further cut into five equal sections of 1 cm × 2 mm × 3 mm for the five assays and stains indicated. The numbers on the 6 gel sections on the left correspond to modulus.

