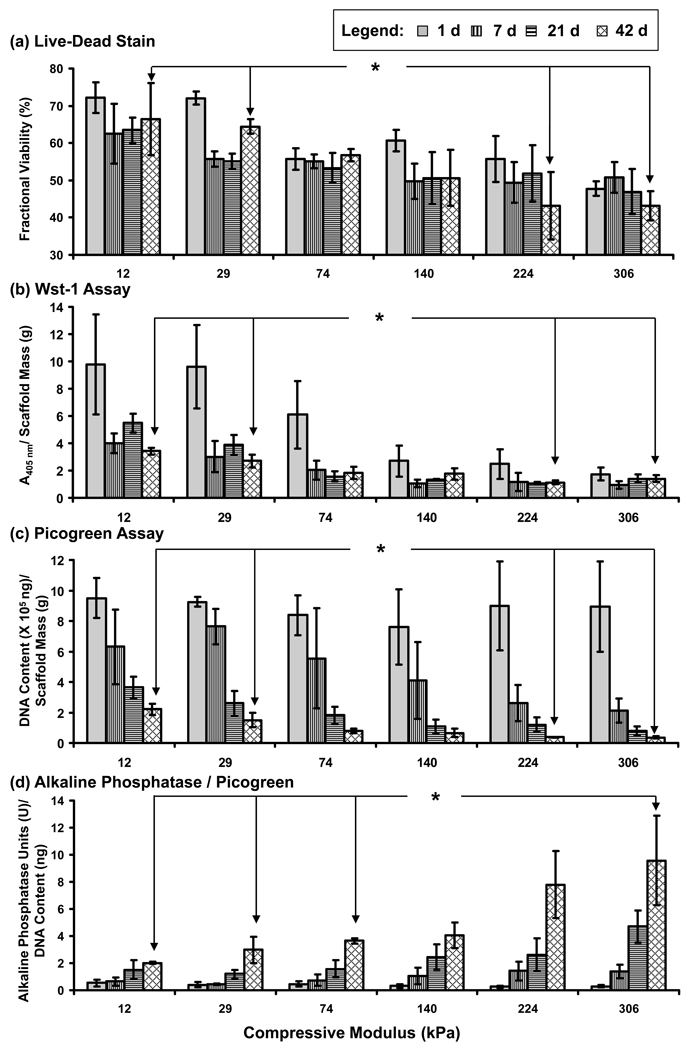
Figure 4.
Cell response in the modulus gradients determined at 1 d (solid gray), 7 d (vertical lines), 21 d (horizontal lines) and 42 d (cross-hatched) for the following tests: (a) fractional viability determined by Live/Dead staining, (b) metabolic activity from Wst-1 assay, (c) DNA content from Picogreen assay, and (d) alkaline phosphatase expression activity normalized to DNA content. Note that all measurements in (b), (c) and (d) were normalized to the mass of the gel slices to account for differences in the size of the gel slice. Error bars are standard deviation and n is 3 for all data points. Statistically significant differences (p < 0.05) for 42 d results are indicated by an asterisk (1-way ANOVA with Tukey’s) (if an asterisk is encountered when following the line between two data points, then the data points are significantly different). See Fig. S2 for a more complete statistical analysis. The legend provided at the top of the figure applies to all panels (a–d).

