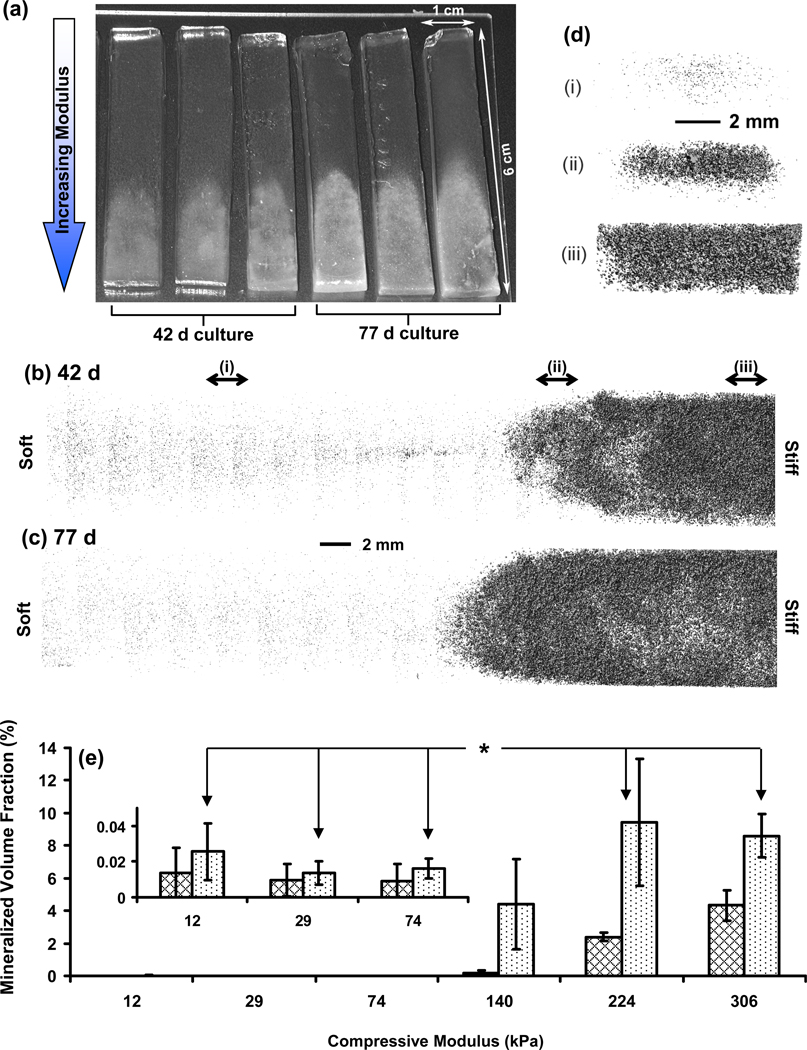
Figure 6.
(a) Photograph of deposited mineral gradients induced by hydrogel stiffness gradients after 42 d and 77 d culture of encapsulated osteoblasts. Deposition of minerals in the stiffer ends of the gradients causes a change in appearance from transparent to white. Representative 3-D reconstructions of the mineral deposits in the gradients at 42 d (b) and 77 d (c) from µCT scans of the hydrogel scaffold gradients. The 3D images shown are composites of scans from the six segments corresponding to the different moduli and the scale bar between (b) and (c) applies to both images. (d) Images present cross-sectional view of the 42 d mineral distribution for 3 mm thick slices at three different positions along the gradient as indicated in (b) by the lower case roman numerals [(i), (ii), (iii)]. Scale bar in (d) applies to all three cross sections. (e) µCT volume analysis of the mineral content in the gradients at 42 d (cross-hatched) and 77 d (dotted) indicating spatio-temporal differences in mineralization with change in modulus. Inset presents the smaller values for the softer segments. Error bars are standard deviation and n is 3 for all data points. Statistically significant differences (p < 0.05) for 77 d results are indicated by an asterisk (1-way ANOVA with Tukey’s). If an asterisk is encountered when following the line between two data points, then the data points are significantly different. See Fig. S4 for complete statistical analysis.

