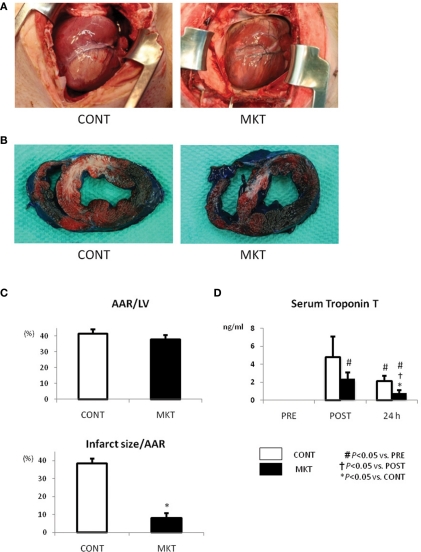
Figure 2.
Infarct size and serum troponin T of swine subjected to I/R insult. (A) External view of the hearts prior to extirpation (24 h after I/R insult). Macroscopic infarct area (whitish lesion) downstream the coronary occlusion in the MK-treated (MKT) heart was much smaller than that in CONT heart. (B) Representative pictures of ventricular tissue sections from CONT and MKT swine at 24 h after I/R insult. Tissue stained blue by Evans blue represents non-ischemic area; tissue stained red by TTC indicates viable area. Tissue not stained by either Evans blue or TTC appears pale to white and represents infarct myocardium. (C) Infarct size was measured as the percentage of LV area of that of total ischemic area at risk (AAR). Values are mean ± SEM of AAR/LV and infarct size/AAR (CONT n = 3, MKT n = 3; *p < 0.05 vs. CONT, ANOVA). (D) Serum troponin T levels before (“PRE”), 2 and 24 h after I/R insult. Values are mean ± SEM (CONT, n = 7; MKT, n = 7). The differences between “PRE,” “POST,” and “24 h” within the CONT and MKT groups were tested by the paired Student’s t-test in such a way that each animal served as its own control (#p < 0.05 vs. PRE, †p < 0.05 vs. POST). The difference between the CONT and MKT groups at any moment was tested by ANOVA (*p < 0.05 vs. CONT).

