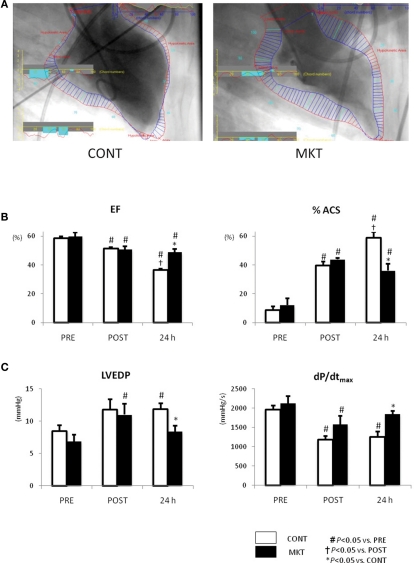
Figure 4.
Left ventricular function assessed by catheterization and LVG before and after I/R. (A) Representative images of LVG (60° right anterior oblique projection) at 24 h after I/R. Normal kinetic and hypokinetic chords (blue and red bars, respectively) were drawn along the centerline methods, and percentage abnormality segments (%ACS) was counted automatically using a computer software (QCA-CMS, Goodman, Japan). Hypokinetic area (a zone of red bars) in the MKT swine is appreciably less than that in the CONT swine. (B) Ejection fraction (EF) and %ACS measured in LVG before (“PRE”), 30 min after I/R (“POST”), and 24 h after I/R. Values are mean ± SEM (CONT, n = 7; MKT, n = 8). (C) LV end-diastolic pressure (LVEDP) and maximum first derivative of LV pressure (dP/dtmax) measured before (PRE), 30 min after I/R (“POST”), and 24 h after I/R. Values are mean ± SEM (CONT, n = 8; MKT, n = 8). The differences between “PRE,” “POST,” and “24 h” within the CONT and MKT groups were tested by the paired Student’s t-test in such a way that each animal served as its own control (#p < 0.05 vs. PRE, †p < 0.05 vs. POST). The difference between the CONT and MKT groups at any moment was tested by ANOVA (*p < 0.05 vs. CONT).

