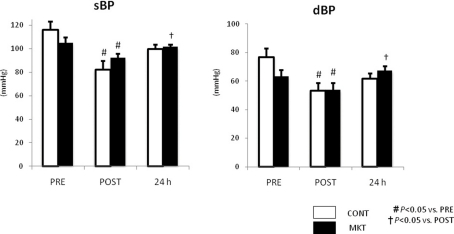
Figure 5.
Blood pressure (BP) response to I/R. Systolic BP (sBP) and diastolic BP (dBP) were measured before (“PRE”), 30 min after I/R (“POST”), and 24 h after I/R. Values are mean ± SEM (CONT, n = 8; MKT, n = 8). The differences between “PRE,” “POST,” and “24 h” within the CONT and MKT groups were tested by the paired Student’s t-test in such a way that each animal served as its own control (#p < 0.05 vs. PRE, †p < 0.05 vs. POST). The difference between the CONT and MKT groups at any moment was tested by ANOVA.

