
Figure 1. Mechanics and Ca transients of isolated wild type and Hsp20 TG cardiomyocytes.
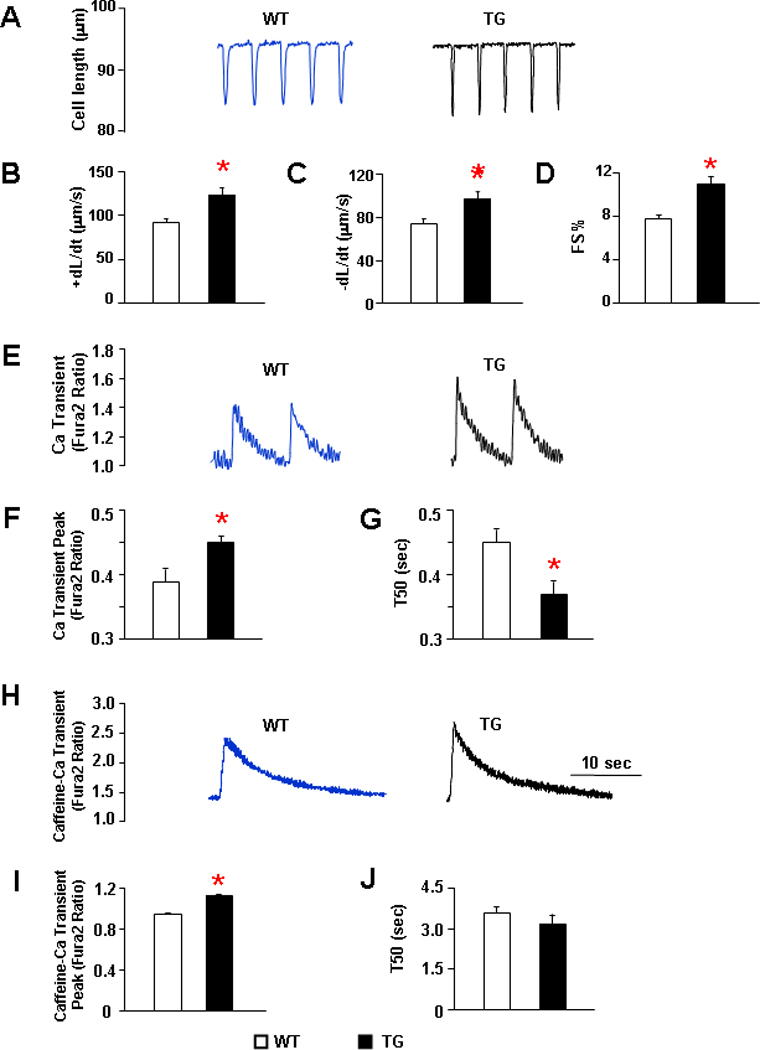
Isolated cardiomyocytes from 12–16 weeks old mice were suspended in 1.8mM Ca-Tyrode solution and field-stimulated at 0.5Hz. (A) Representative cell shortening traces of WT and TG cells. (B) Maximum rates of contraction (+dL/dt). (C) Maximum rates of relaxation (−dL/dt). (D) Fractional shortening (FS%) and (E) Representative tracings of Ca transients in WT and TG cardiomyocytes. (F) Ca transient peak. (G) Time to 50% of decay of Ca transient in WT and Hsp20 TG myocytes. (H) Representative tracings of caffeine induced Ca transient. (I) Caffeine-induced Ca transient amplitude and (J) Time to 50% decay of caffeine-induced Ca transient peak. n = 36–42 cells from 5 hearts for each group. Values = mean ± SEM. *: P<0.01 vs. WT.