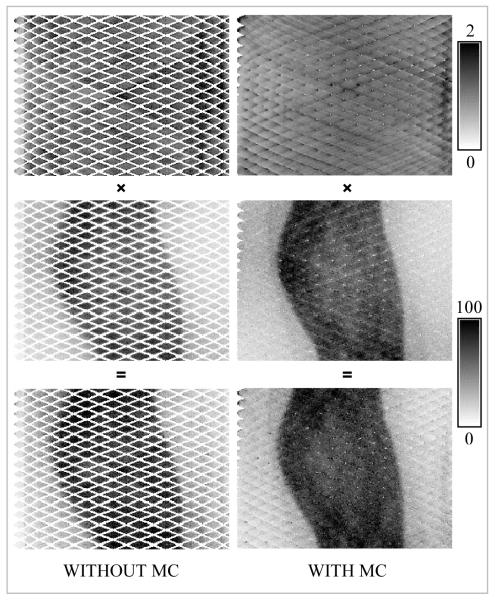
FIGURE 4.
Representative sinograms for the BrainPET scanner before and after applying spatial transformations. The normalization and the corresponding prompt sinograms from the data acquired with the Hoffman phantom and their product are shown in the top, middle and bottom rows, respectively. Note the empty bins in the data uncorrected for motion. After applying the transformation most of these bins were filled with data in both the prompts as well as the normalization sinograms.

