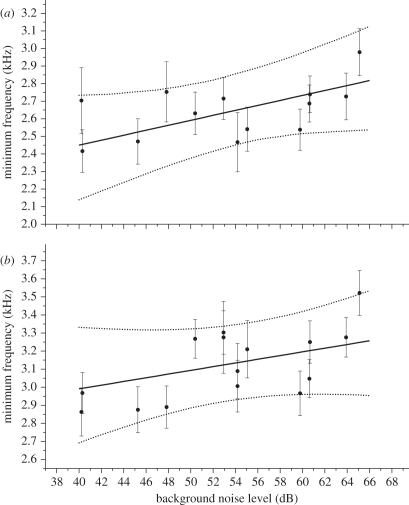
Figure 1.
Minimum frequency of silvereye (a) song and (b) calls versus the noise level at a site. Solid lines, predicted relationship; dashed lines, 95% CI. The dots are the mean of the posterior distribution of song frequency at each site, and the error bars are s.d. of the posterior distribution (equivalent to the s.e.).

