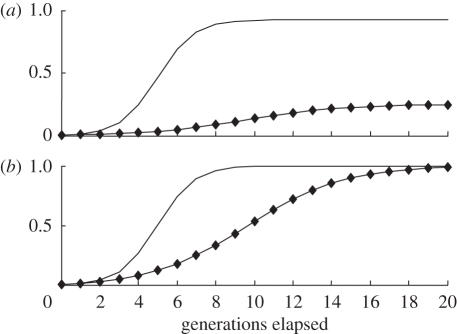
Figure 1.
How religious defections influence social and genetic evolution. The diagrams refer to an ultra-high-fertility religious group. (a) Share of believers; (b) share of allele R. A high defection rate reduces the eventual share of religious believers (group r) in the population. Whatever the defection rate, the religiosity allele R eventually tends to fixation. The diagram assumes: both variants: cr/cn = 3.0; pRr (0)=0.005, prN (0)=0, pRn (0)=0, pNn (0)=0.995; low defection: sRr=0.05, sNr=0.07, sRn=0, sNn=0; high defection: sRr=0.5, sNr=0.07, sRn=0, sNn=0. Line without diamonds, low defection; Line with diamonds, high defection.

