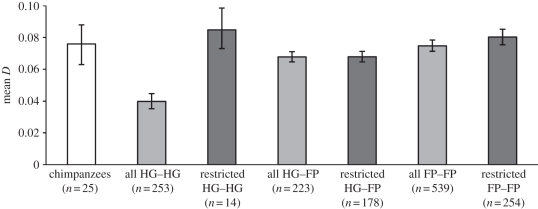
Figure 2.
Average pairwise D-values (and 95% CIs) of chimpanzee (empty bar) and human groups (grey bars) with different combinations of subsistence systems. Sample sizes (number of pairs of groups) are shown in brackets. For humans, light grey bars represent values for all pairs of groups, and dark grey bars represent values for the restricted sample consisting only of pairs of groups belonging to different ethnolinguistic groups and speaking languages belonging to different language families. HG, hunter–gatherer; FP, food producer.

