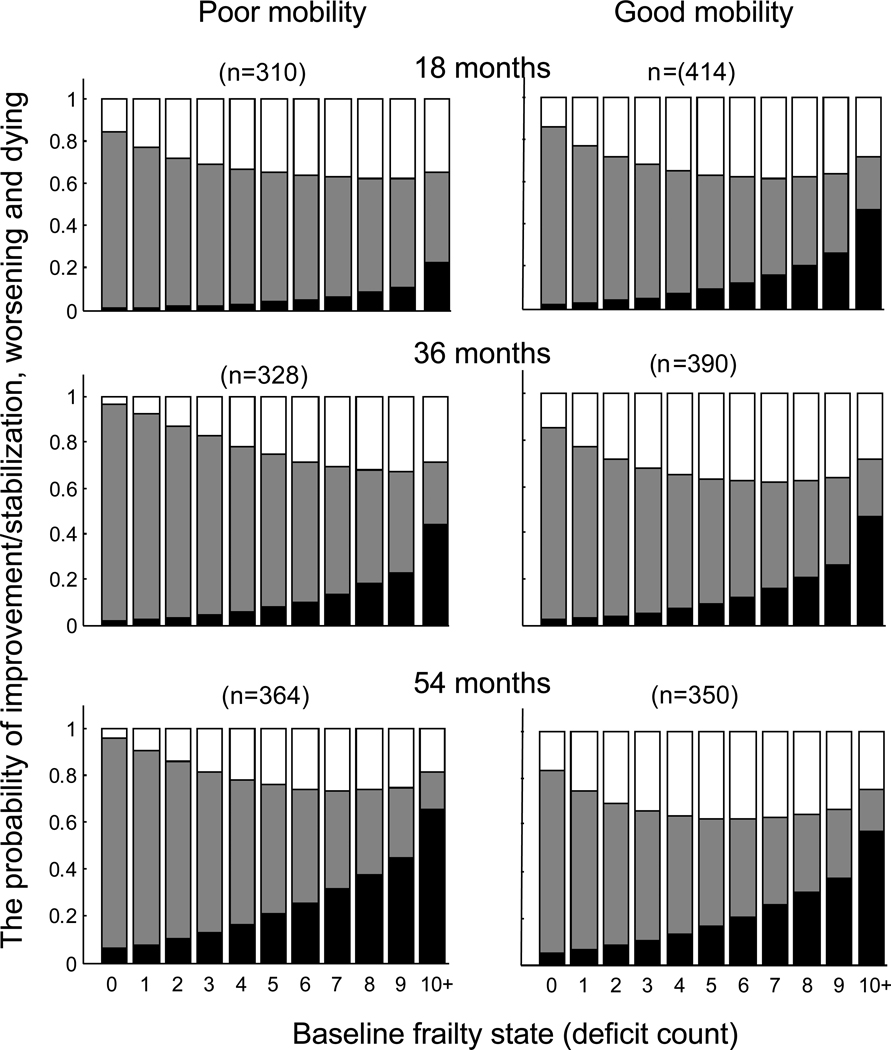
Figure 1.
Changes in frailty status (deficit count) in relation to baseline mobility for three consecutive follow-up assessments. The probability of improvement or stability is indicated in white, worsening is shown in grey, and probability of death is shown in black. The probabilities of the outcomes among participants with poor mobility (>10 sec on rapid gait test) are shown at the left panels; the probabilities of the outcomes among participants with good mobility are presented at the right panels. The upper panels show the transition probabilities after the first 18 months, the middle panels displays the probabilities of transitions between baseline and 36 months and the bottom panel shows the probabilities between baseline and 54 months. The last state (10+) refers to the “collapsed states” for those who had 10 deficits and over (<8%).

